Case Studies

Agent-Based Crop Health Simulation

From smart farming variables to agent-based crop health simulation and 3D field behavior visualization.

GitHub
Agent-Based Crop Health Simulation

Focus

Agent-Based Modeling, Simulation, Crop Analytics

Scope

Dynamic crop health prediction workflow

Role

Feature engineering, ABM design, simulation analysis

Summary

Overview

Agent-Based Crop Health Simulation is a data analytics and simulation project that estimates crop viability under dynamic environmental conditions. Each crop record is treated as an individual agent whose growth, risk, and viability states evolve over time based on nutrients, water availability, atmospheric conditions, biotic stress, and management context. The project also includes a NetLogo 3D simulation view to visualize crop-agent behavior and health-state changes across a simulated field environment.

Case Study

Agent-Based Modeling Process

01

Simulation workflow

agent-based modelingcrop viabilitydynamic simulation

This project models crop health as a dynamic simulation system instead of a one-time static prediction. Each crop record becomes an agent whose viability changes over time based on support and stress conditions.

  • Represents each crop record as an individual crop agent.
  • Models growth, risk, and viability as evolving states.
  • Balances environmental support factors against stress pressure over time.
02

Theoretical framework

ABMcrop agentssupport vs stress

The model is based on Agent-Based Modeling, where crop health emerges from interactions between crop agents and environmental, biotic, and management factors.

Concept
Meaning
Agent
Each crop record is treated as an individual crop unit
Environment
Soil, water, atmosphere, biotic stress, and management context
Internal state
Growth condition, stress level, risk, and viability
Emergent output
Crop viability evolves from support and stress interactions
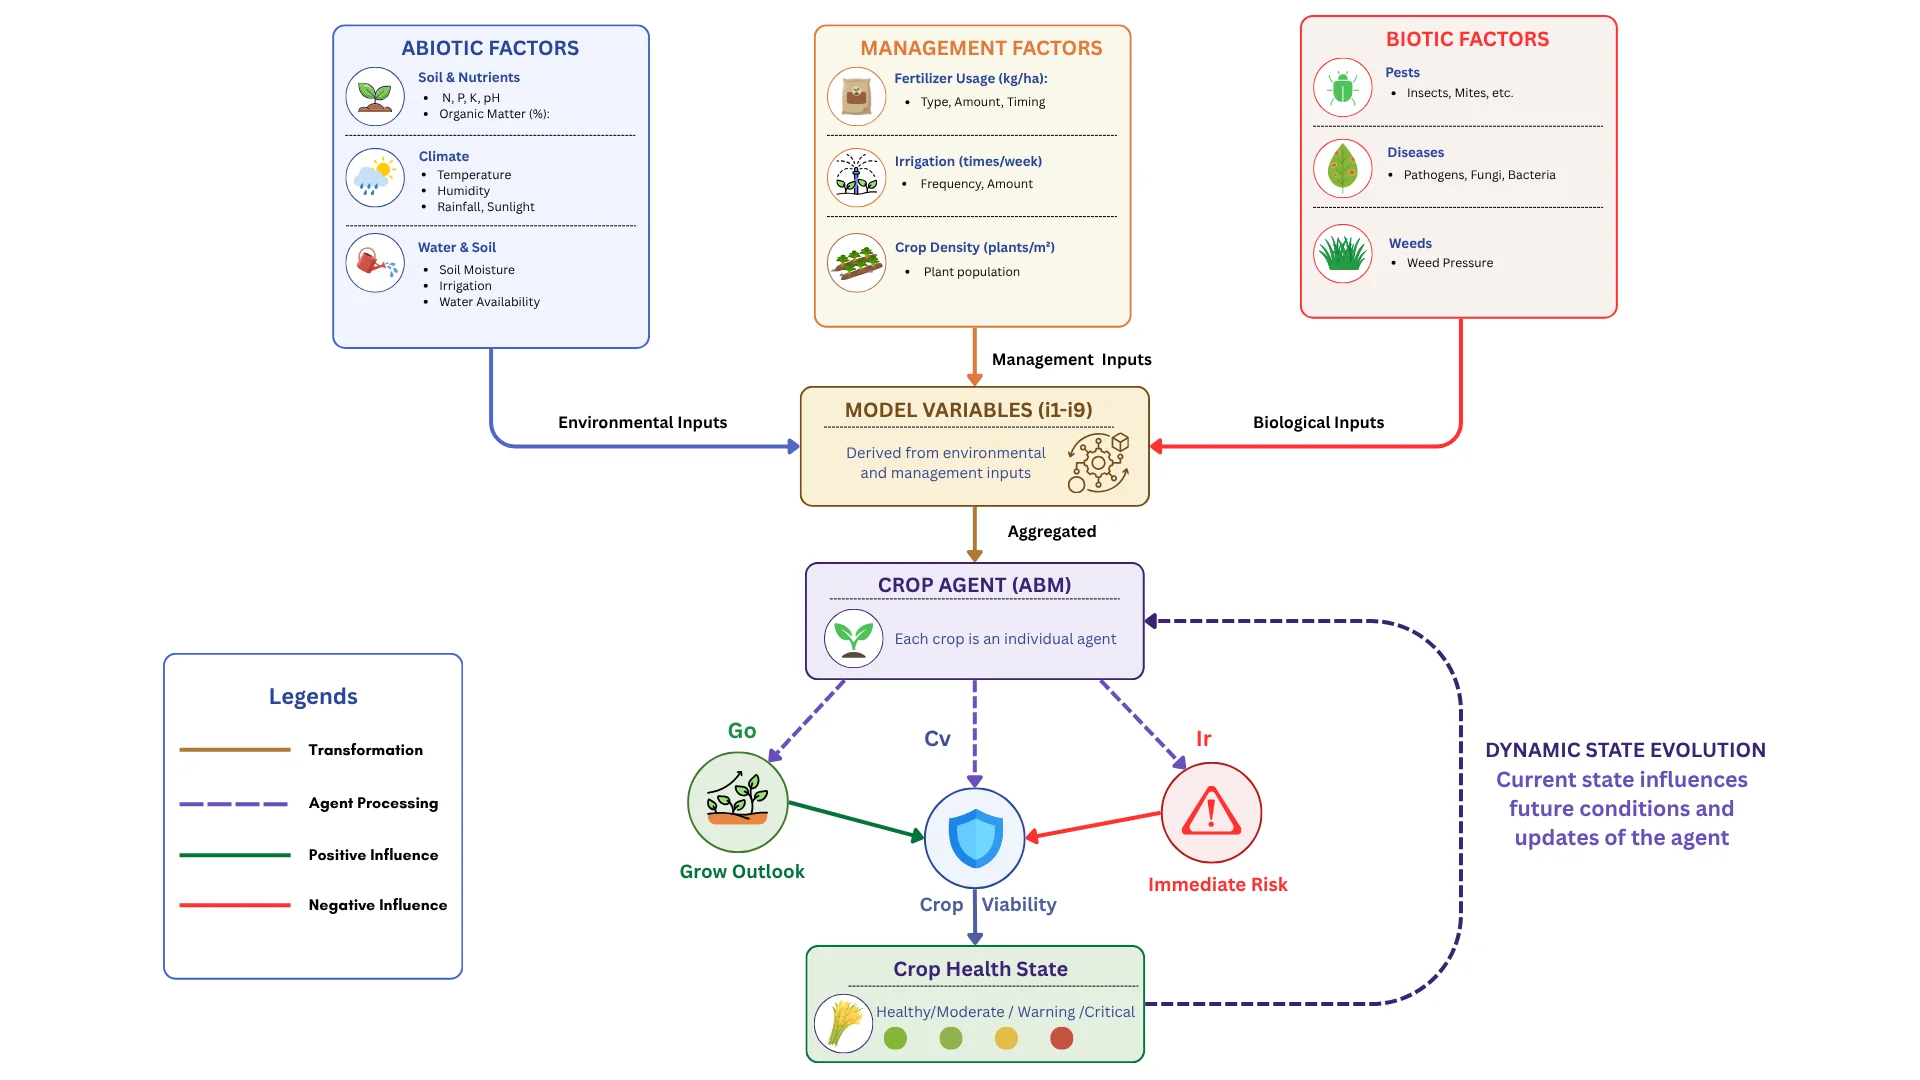
Crop ABM theoretical framework
Conceptual framework showing how smart farming variables are transformed into crop-agent states and crop health outputs.

03

Dataset and variables

Smart Farming Dataset 2024environmental variablesmanagement context

The project uses Smart Farming Dataset 2024, containing environmental, biotic, water, soil, and management variables used to describe crop conditions.

  • Categorical variables were encoded for modeling.
  • Continuous variables were normalized to keep feature ranges consistent.
  • Raw smart farming measurements were transformed into interpretable simulation inputs.
Variable Group
Examples
Soil and nutrients
N, P, K, pH, organic matter
Atmosphere
Temperature, humidity, rainfall, sunlight, wind speed, CO2
Water
Soil moisture, irrigation frequency, water usage efficiency
Biotic stress
Pest pressure, frost risk
Context
Soil type, water source type, growth stage, crop label

04

Feature engineering and aggregation

THIVPDGDDi1-i9 indicators

Raw smart farming variables were transformed into engineered features and aggregated into nine interpretable indicators representing support and stress signals.

  • Engineered features include Temperature-Humidity Index, Vapor Pressure Deficit, Growing Degree Days, Soil Moisture Deficit, and nutrient ratios.
  • Feature aggregation reduces raw variables into interpretable crop-condition signals.
  • The i1-i9 indicators act as the input layer for the simulation model.
Indicator
Meaning
i1
Nutrient level and balance
i2
Soil context
i3
Atmospheric support
i4
Atmospheric stress
i5
Water support
i6
Water deficit
i7
Growth readiness
i8
Biotic and environmental stress
i9
Management context

05

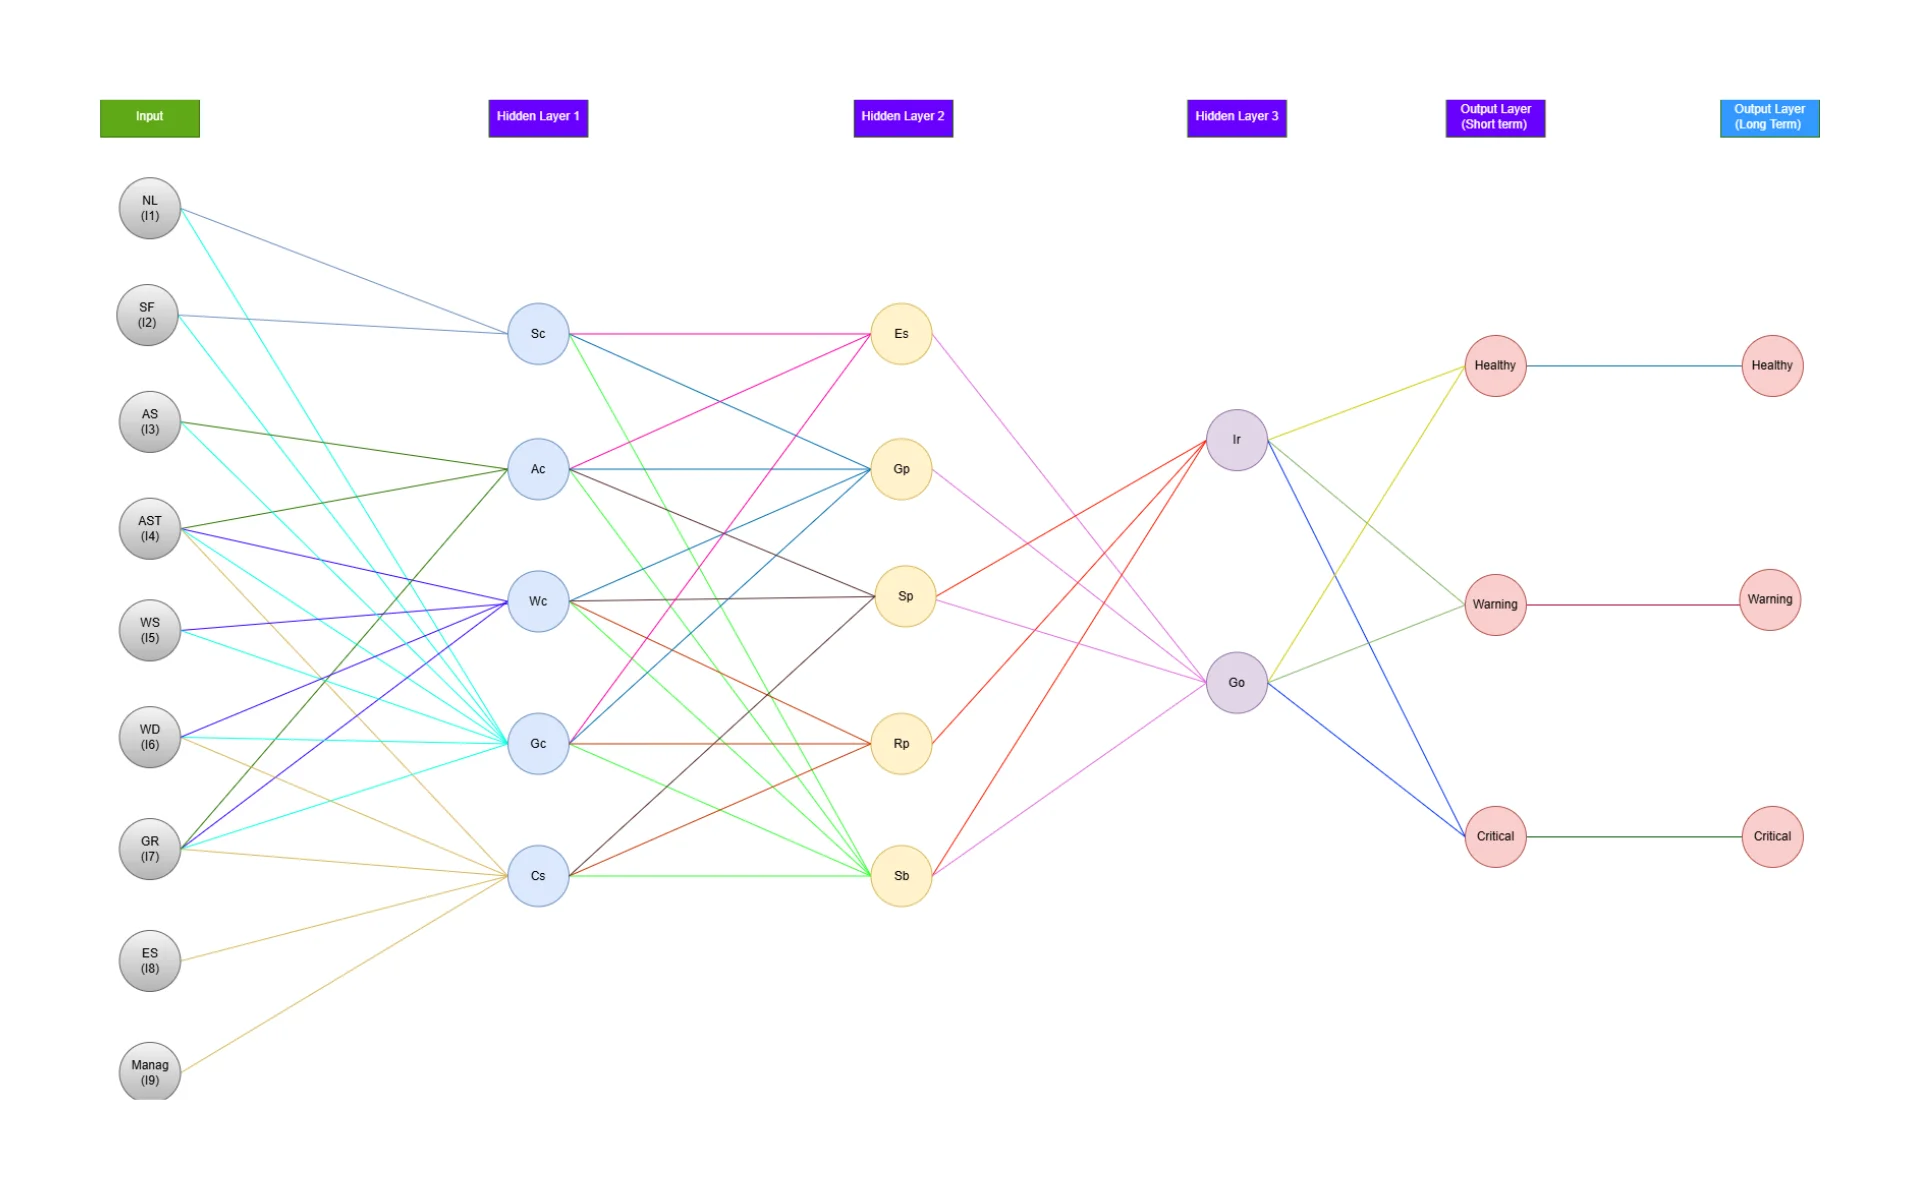
Layered model architecture

input layercondition layerbehavior layerviability output

The ABM workflow uses a layered structure that maps aggregated indicators into condition states, behavior states, inference outputs, and final crop viability prediction.

Layer
Variables
Purpose
Input
i1-i9
Aggregated environmental, biotic, and management indicators
Condition
Sc, Ac, Wc, Gc, Cs
Represents soil, atmosphere, water, growth, and sensitivity states
Behavior
Es, Gp, Sp, Rp, Sb
Models suitability, growth potential, stress, risk, and stability
Inference
Go, Ir
Estimates growth outlook and immediate risk
Output
Cv, LCv
Computes short-term and long-term crop viability
Crop ABM layered model architecture
Layered architecture mapping i1-i9 indicators into crop condition states, behavior states, and viability outputs.

06

Core model logic

GoIrCvLCv update

The simulation connects growth outlook and immediate risk into crop viability, then updates long-term viability gradually over time.

  • Go represents expected growth under current conditions.
  • Ir represents immediate risk driven by stress and instability.
  • Cv combines growth support and risk pressure into short-term crop viability.
  • LCv smooths crop viability over time instead of changing instantly.
Formula
Meaning
Cv = Go x (1 - Ir)
Crop viability increases with growth outlook and decreases as immediate risk increases.
LCv(t + Dt) = LCv(t) + eta LCv [ Cv(t) - LCv(t) ]Dt
Long-term viability adapts gradually toward the current crop viability value.

07

Dynamic simulation

T = 800dt = 0.01LCv updatetime-based behavior

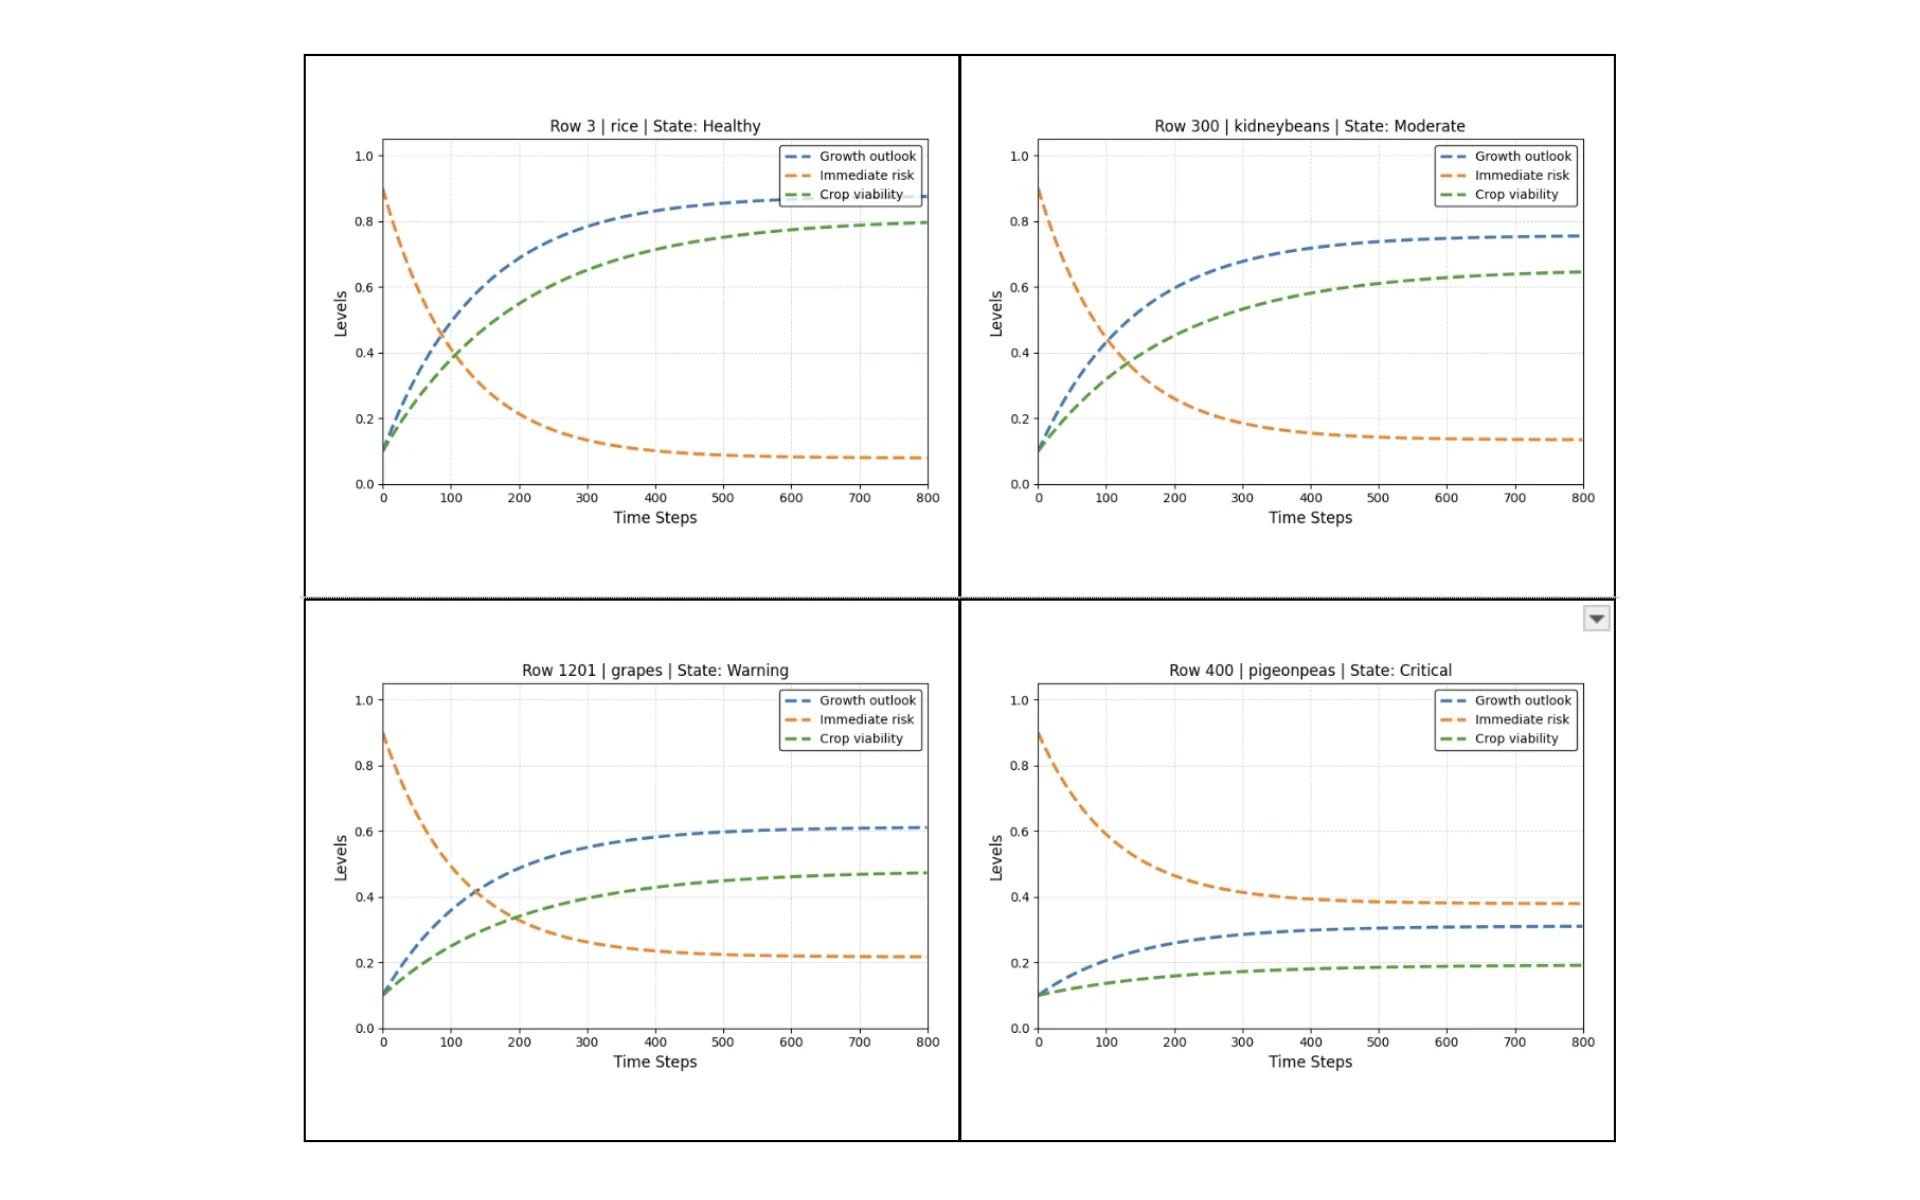
The model updates crop viability over time using long-term dynamic adaptation, allowing crop health to evolve gradually instead of changing instantly.

  • At each time step, i1-i9 indicators are processed into condition and behavior states.
  • Growth Outlook and Immediate Risk are computed from the model layers.
  • Crop Viability is calculated from growth outlook balanced against immediate risk.
  • Long-term viability updates gradually over the simulation horizon.
Output
Meaning
Go
Growth Outlook
Ir
Immediate Risk
Cv
Short-term Crop Viability
LCv
Long-term Crop Viability
Crop ABM time-series simulation
Time-series simulation showing how crop health outputs evolve over the simulation period.

08

NetLogo 3D simulation

NetLogo 3Dcrop agentssimulation visualization

The ABM simulation was extended into a NetLogo 3D environment to make crop-agent behavior easier to observe visually. Instead of only reading time-series outputs, the simulation shows crop agents changing health states across a field-like environment.

  • Built a 3D agent-based simulation view using NetLogo.
  • Represented crop units as agents inside a simulated field environment.
  • Used visual state changes to show how crop health evolves over time.
  • Connected the simulation concept to the same ABM logic used in the crop viability workflow.
NetLogo 3D simulation preview showing crop agents changing health states across a simulated field environment.

09

Decision framework

HealthyModerateWarningCritical

The simulation outputs are interpreted using crop health states and growth-risk relationships, making the model easier to explain than a black-box score.

  • High growth and low risk indicate a healthy crop state.
  • Low growth and low risk indicate a moderate crop state.
  • High growth and high risk indicate a warning state.
  • Low growth and high risk indicate a critical state.
Crop State
LCv Range
Healthy
LCv >= 0.75
Moderate
0.55 <= LCv < 0.75
Warning
0.35 <= LCv < 0.55
Critical
LCv < 0.35

10

Visual analytics

time seriesfeature relationshipsglobal behavior

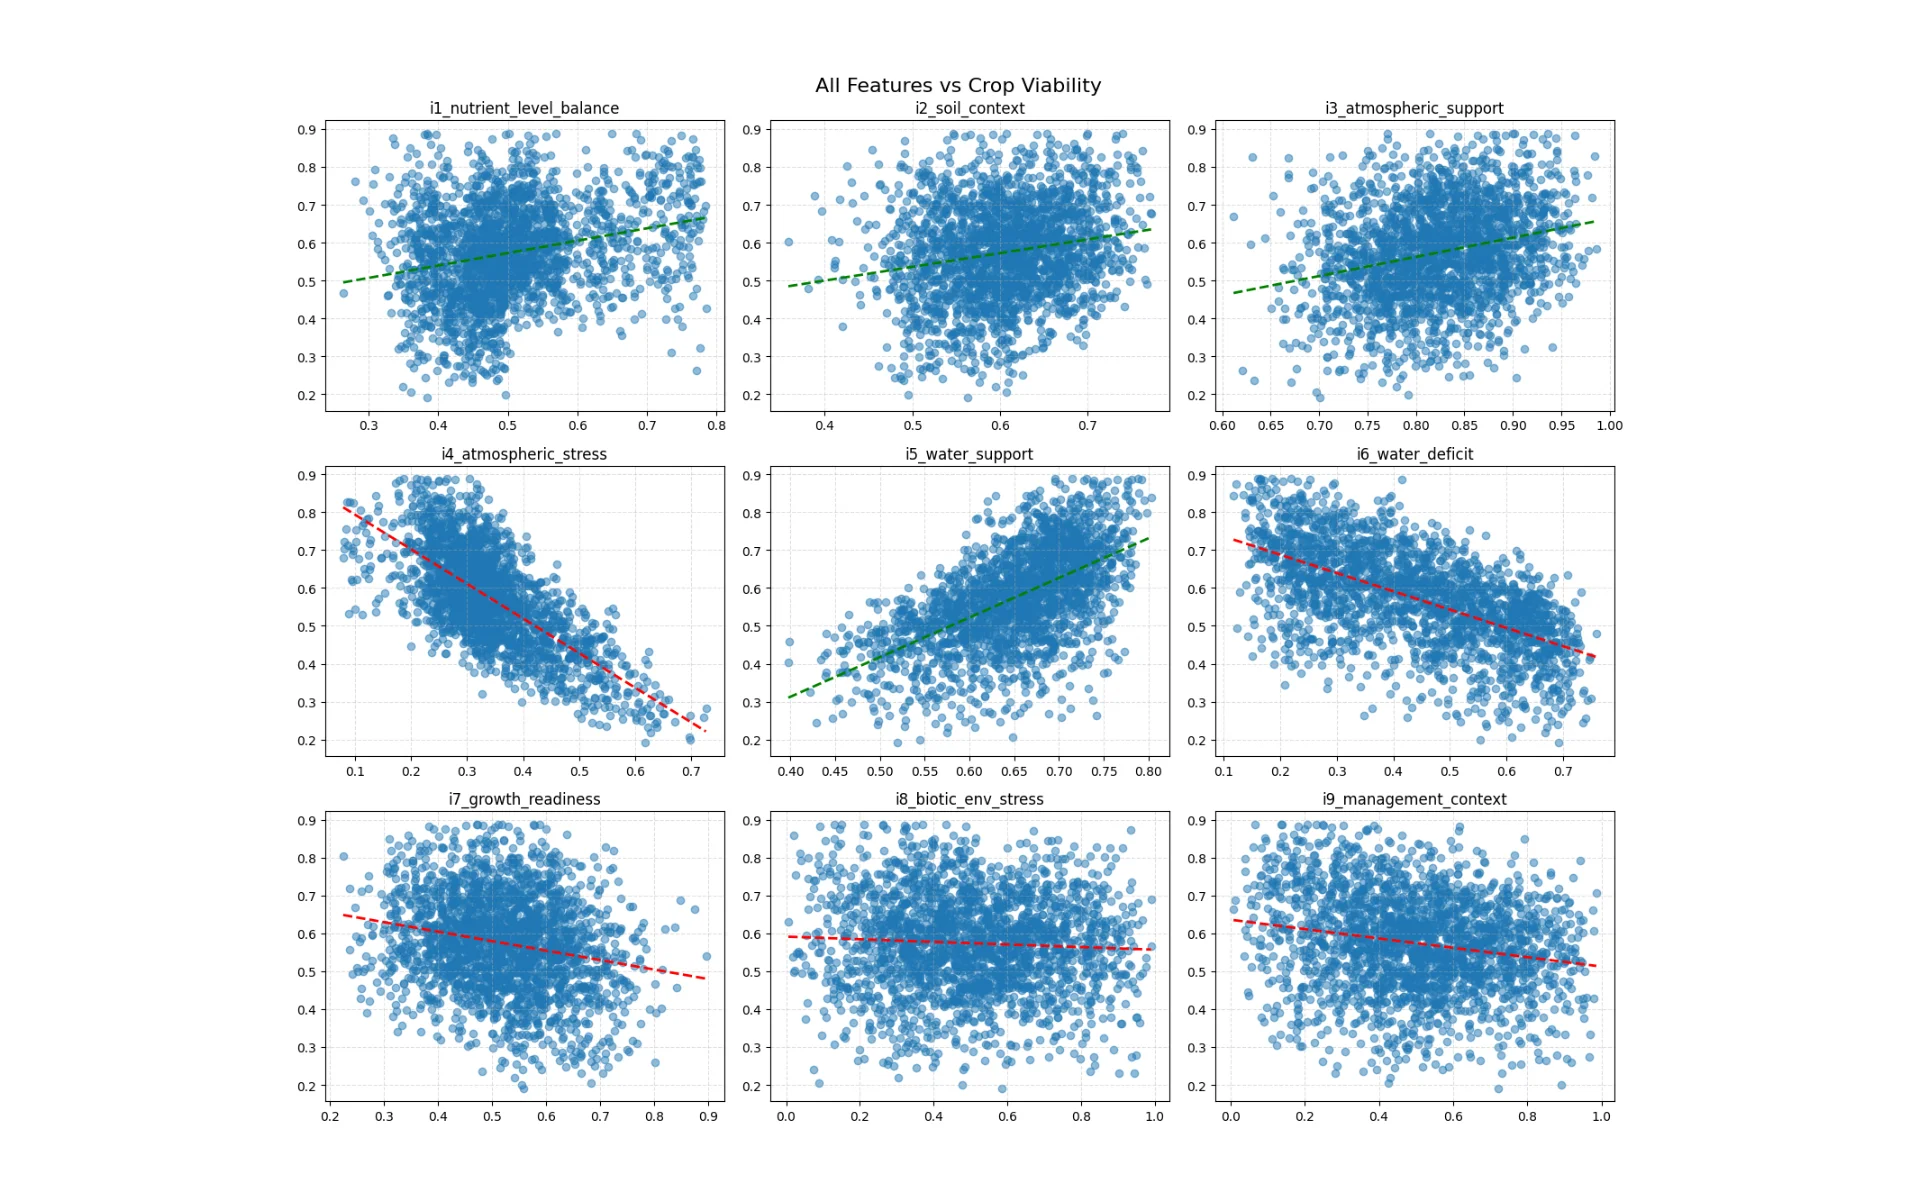
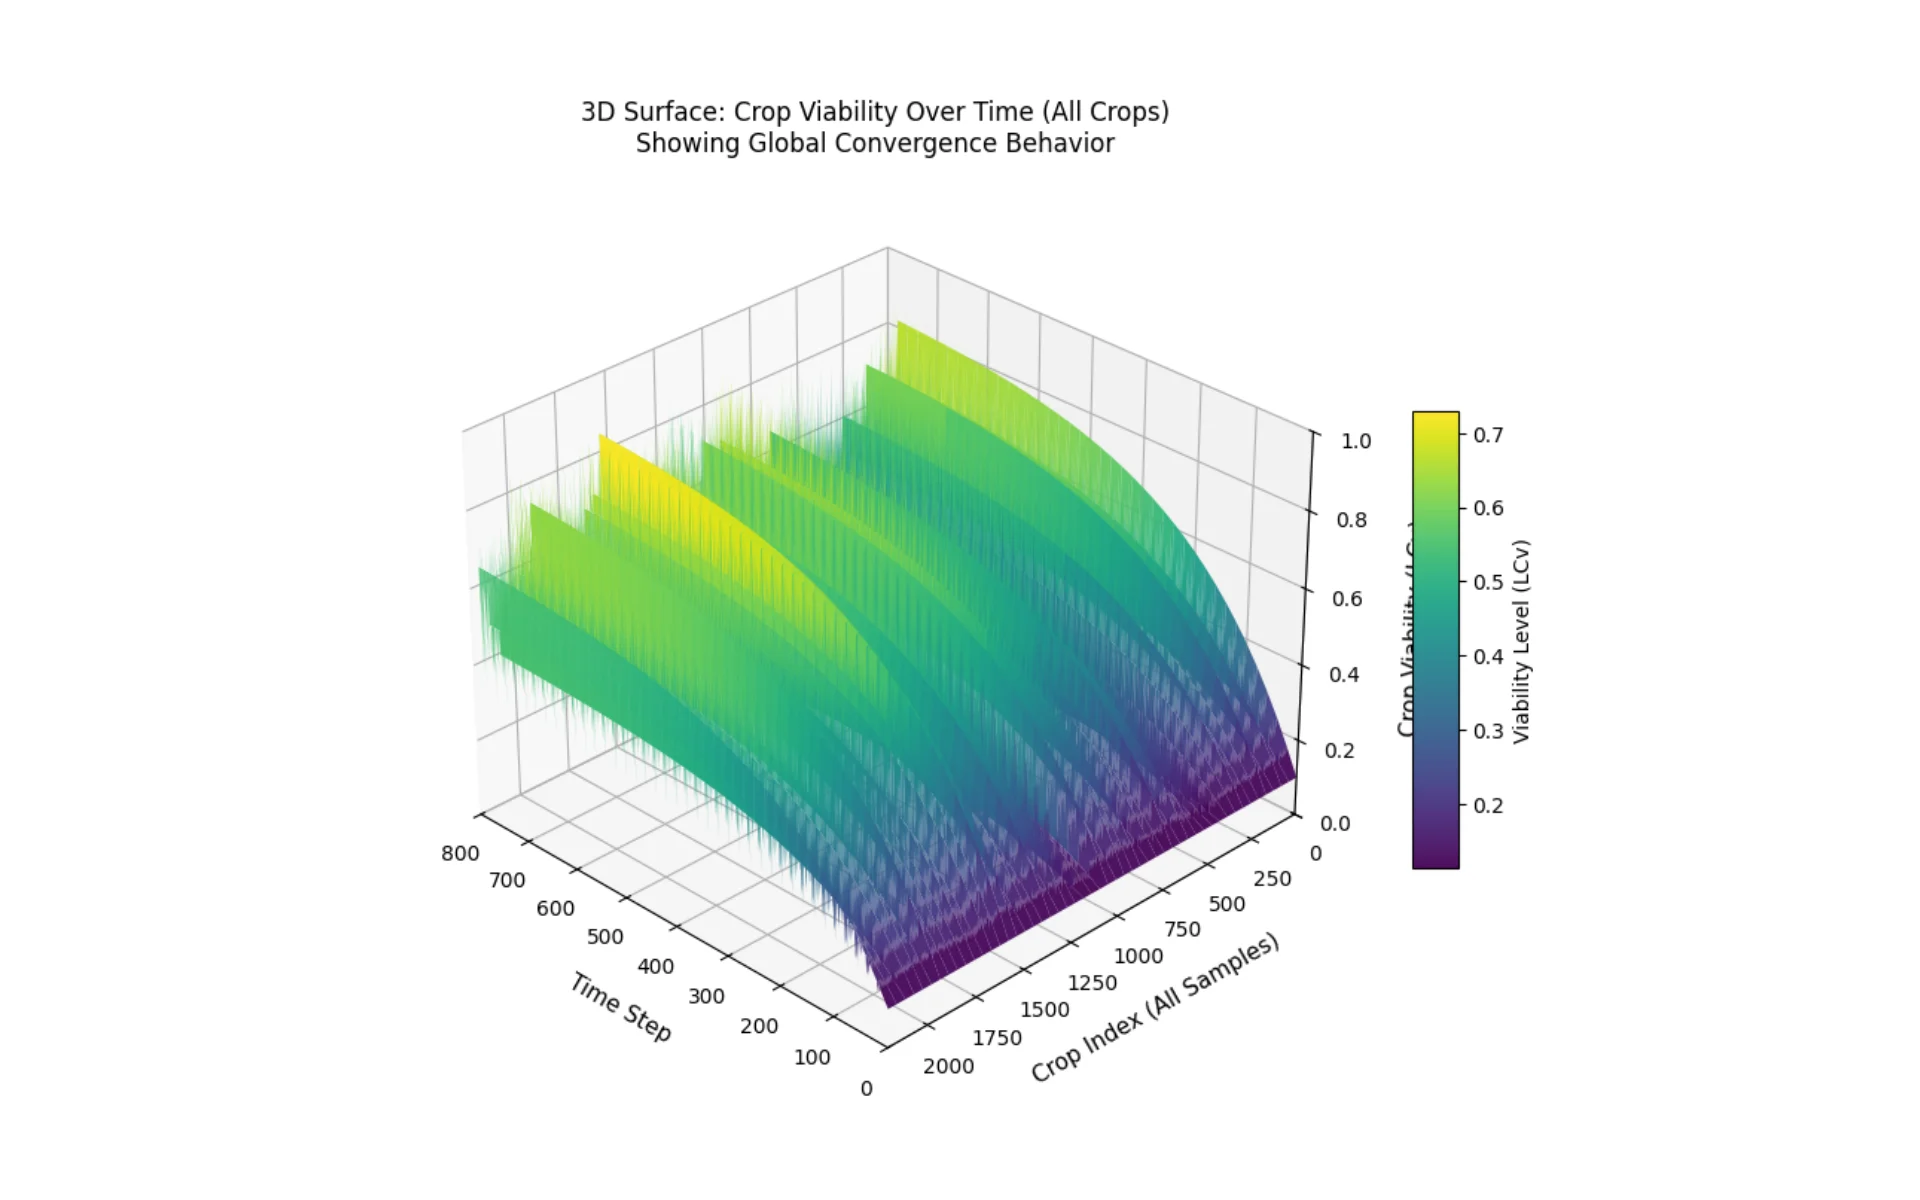
The project uses visualizations to inspect crop health patterns, feature relationships, and global system behavior across simulated agents.

  • Generated time-series plots for simulation behavior.
  • Used feature-to-viability analytics to inspect relationships between indicators and outcomes.
  • Visualized global behavior patterns to understand stability and convergence.
Crop ABM feature scatterplot
Feature-level visualization used to inspect relationships between crop condition indicators and model outputs.
Crop ABM global convergence behavior
Global convergence behavior showing how simulated crop viability patterns stabilize over time.

11

Notebook workflow

preprocessingfeature aggregationmodeling results

The repository is organized into a three-stage notebook workflow covering preprocessing, feature aggregation, and simulation results.

  • The workflow separates data preparation, feature aggregation, and modeling into reproducible stages.
  • Core model logic is implemented in src/model.py.
  • Visual outputs are generated and saved under results/figures/.
Notebook
Purpose
01_data_preprocessing.ipynb
Handles missing values, encoding, normalization, and dataset preparation
02_feature_aggregation.ipynb
Transforms raw and engineered features into i1-i9 indicators
03_modeling_and_results.ipynb
Runs the ABM simulation, computes outputs, and generates visualizations

12

Build Stack

The stack combines Python data processing, interpretable simulation logic, agent-based modeling, and Matplotlib visual analytics.

PythonNumPyPandasAgent-Based ModelingComputational SimulationDynamic System ModelingMathematical ModelingDeep LearningPredictive ModelingData AnalysisFeature EngineeringMatplotlib

13

Limitations

simulation modelinterpretabilitynot field validation

This project emphasizes interpretable simulation and system behavior rather than direct real-world agricultural deployment.

  • Model outputs depend on the assumptions and weights defined in the simulation logic.
  • The model is predictive in a simulation sense, not a supervised machine learning model trained on real future crop outcomes.
  • The system is designed for analytical interpretation, not direct field diagnosis.
  • Further validation would require real crop outcome data and expert agronomic review.
  • The model simplifies complex crop-environment interactions into structured indicators and update rules.

14

Reflection

dynamic systemsinterpretable modelingcrop health analytics

This project helped me understand how simulation can model crop health as a time-dependent system rather than a static prediction problem.

  • Learned how raw environmental variables can be transformed into interpretable indicators.
  • Designed a layered model that connects support, stress, risk, and viability.
  • Used simulation outputs and visual analytics to explain crop health behavior over time.

More Projects

View all projects